Part 4: Human Geography Statistics
It is an indisputable fact that humans interact with and change their environments. The consequences of these interactions can be either positive or negative, and they can affect either a small ecosystem within a greater biome or the world as a whole. It is also true that countries as a single entity can have a much greater impact on the environment than a single individual. The purpose of this section is to discuss in greater detail the environmental consequences that the people of France have created for themselves and for others.
Water Availability

As you can see in the above chart, France has approximately 3.26 thousand cubic meters of water available to it. It is relatively low on the list compared to the rest of the world. Water losses are greater in France than in other European countries, such as England (19%) and Germany (7%). Water losses in France come out to a staggering 26%, almost one third of its total supply.
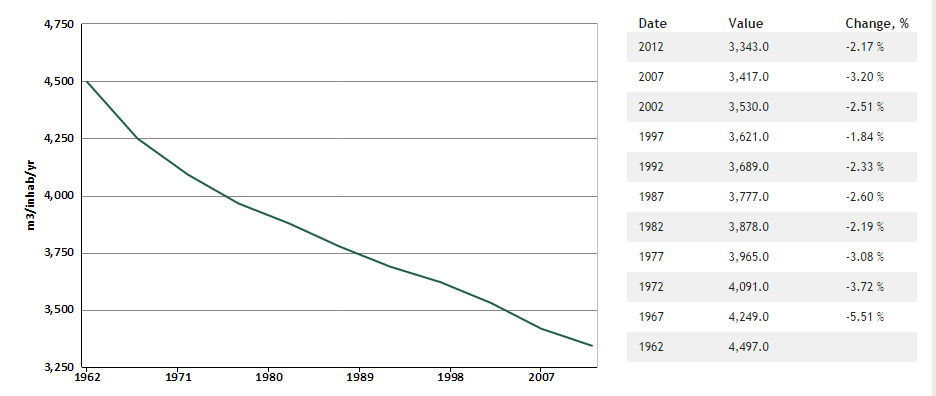
France - Total Renewable Water Resources per Capita
France's renewable water supply is on a slow and steady decline. Water available to each indicidual each year has been reduced by a staggering 1,154 meters cubed. This change is quite inevitable, what with the increase in population, but measures to preserve water supply must be taken quickly to ensure every citizen has access to water for years to come. Water is becoming an increasingly precious commodity and wastage of it cannot be afforded if we intend to be able to support France's -- and the world's -- growing population.

France, circled in green, uses around 512.4 meters cubed of water per inhabitant per year. While it may not seem like a lot compared to giants like the United States and Canada, it is still on the higher end of the water usage spectrum. Most of the residential water use lies in baths and showers, which make up 39% of France's total residential water use. Only 1% of residential water use in France is drinking water. Almost everyone in France has access to a piped-in water supply -- 99.5% of residents. Sanitiation processes are similar all throughout France and cover 82% of water there. As far as I can ascertain, the amount of water available in France has no negative effects on its residents.
Gross Domestic Product (GDP)

France has a GDP (purchasing power parity) of $2.276 trillion, ranked tenth out of the world. Right above it is the United Kingdom ($2.387 trillion), with Mexico ($1.876 trillion) right below. France's annual growth rate is a steady 0.3%. It is ranked 191st out of the world in this area. It is so low on the list because most developing countries are, as the name suggests, developing very quickly, and so have dramatically higher rates of growth than that of an already-developed country like France. France is ranked seventh out of the world in terms of exports. However, France is clearly a debtor nation due to it being over two trillion euros in debt (see the debt clock using the button above.) France's debt as a percentage of its GDP would be at around 90%. As you can see in the above graph, France has a higher GDP (per capita) than the United Kingdom but a lower GDP than Germany. It has remained between the two for the most part, except in 1980 when it was on top with a GDP of 12,500 euros and 2001 when it was the lowest of the three with a GDP of 21,774 euros.
Renewable Energy
France, unlike many other countries, has formulated a comprehensive plan of action on this front. Take, for instance, the France National Renewable Energy Action Plan (NREAP). France plans to acheive a legally binding target of getting 23% of its energy from renewable sources by 2020. Below you can see a graph of its progress towards this goal so far.
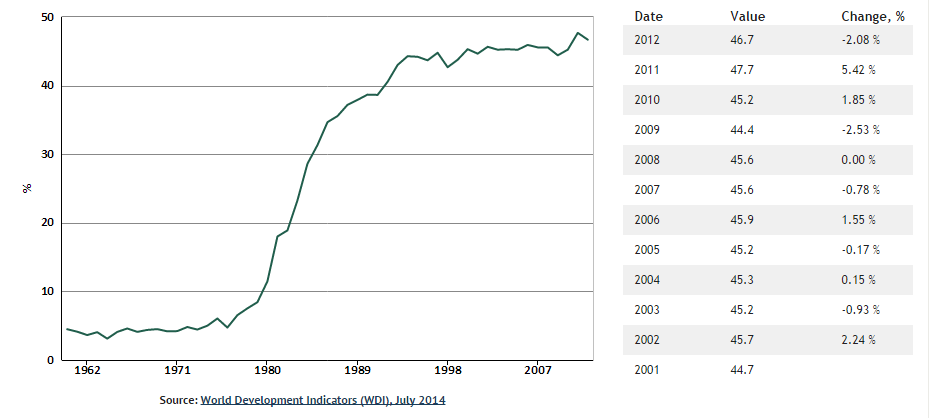
France- Alternative and Nuclear Energy (% of total energy use)
As you can see in the table to the right, alternative and nuclear energy ('clean' energy) make up 46.7% of France's total energy use. Clean energy is defined as energy that does not produce carbon dioxide when generated. Sources of clean energy include hydropower, geothermal, and solar power. The NREAP also states that different energy needs require greater or lesser percentages of renewable energy -- 27% in the electricity sector, 33% in heating and cooling, and 10.5% in transport. These numbers need to be accomplished by 2020. France aims to increase energy efficiency and plans to implement more forms of renewable energy, such as wind energy, solar energy, and bioenergy. See the button below to visit an interactive graph and view data on the percentages of renewable energy use in France from before 2001.
Population

Age structure:
0-14 years: 18.7% (male 6,337,877/female 6,053,185)
15-24 years: 11.9% (male 4,018,044/female 3,837,191)
25-54 years: 38.6% (male 12,851,278/female 12,719,073)
55-64 years: 12.5% (male 4,012,614/female 4,290,624)
65 years and over: 18.3% (male 5,197,519/female 6,941,607)
0-14 years: 18.7% (male 6,337,877/female 6,053,185)
15-24 years: 11.9% (male 4,018,044/female 3,837,191)
25-54 years: 38.6% (male 12,851,278/female 12,719,073)
55-64 years: 12.5% (male 4,012,614/female 4,290,624)
65 years and over: 18.3% (male 5,197,519/female 6,941,607)
France has a relatively stable population. As you can see, there have been no major decreases or increases. There are more people in the post- reproductive age bracket than in any other, indicating an older population overall. Those in the post-reproductive bracket are a dependent group, meaning they have to rely on others (usually of younger ages) for basic care. This means that not all of France's older citizens will be taken care of as there are more of them than there are younger people who will be able to provide this care. Recent trends would indicate a slight decline in population, but the CIA World Factbook tells us that France's population is actually growing at a rate of 0.45%. France's population pyramid is that of a post-industrial society, due to the smaller amounts of children being born. and the higher life expectancies.

France- Total Population, both sexes (this graph is just a different way of looking at the information in the population pyramid.)

This is a visualization of what France's population might look like in 2050. As you can see, there are still more post-reproductive people overall, but the younger groups have definitely been filled out. This could indicate an increase in birth rates. It may also mean better care for seniors in the future, and a stronger economy due to the greater number of working-age people. In this graph, the female population is noticeably larger, with more females living longer lifespans. This will probably have no noticeable effect on the other aspects of France. Using this graph as a reference point, one can conclude that in 2050, France's population will have greater similarity between the percentages of each age group.
France Compared to... the United Kingdom
In terms of population, France and the United Kingdom are quite simliar. The population of France is approximately 66,259,012 people, while the population of the United Kingdom is about 63,742,977 people. France's population grows at around 0.45% annually. However, the population of the United Kingdom is growing faster at a rate of 0.54%. This may be due to the greater number of reproductive-age people in the United Kingdom. Currently, France has more renewable water resources available to it than the United Kingdom. See below:
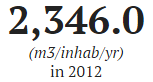
United Kingdom- Total Renewable Water Resources per Capita
|
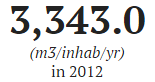
France- Total Renewable Water Resources per Capita
|

United Kingdom- Total Renewable Water Resources per Capita
This huge discrepancy may be due to a previously stated fact -- the population in the United Kingdom is growing a great deal faster than that of France, and perhaps the goverment of the United Kingdom has not had time to deal with this sudden growth by putting new water usage policies in place. If action is not taken, the level of available water in the United Kingdom could drop even lower. Water preservation systems need to be put in place as soon as possible to secure enough water for future generations.
